Book review: What Data Visualization by Kieran Healy teaches beyond the code
Contents
Kodansha Scientific((Kodansha Scientific (@kspub_kodansha) / Twitter. Twitter. Accessed February 21, 2021. https://twitter.com/kspub_kodansha)) kindly sent me a copy of the third volume in their Practical Data Science series, "Dēta bunseki no tame no dēta kashika nyūmon" (Introduction to Data Visualization for Data Analysis)((Kieran Healy. Jissen Data Science Series: Dēta bunseki no tame no dēta kashika nyūmon. Kodansha; 2021. https://www.amazon.co.jp/dp/4065164044)). Thank you very much.
Introduction
Although I have received complimentary copies of medical books several times in the past, this is the first time I have been invited to introduce a book on data science.
I first encountered R about 10 years ago when I was a medical student, but I quickly gave up because I did not understand how to use it at the stage of setting up the working directory and loading data, and I had no one around to ask for help. During graduate school, I used SPSS for my analyses, while hoping to learn R someday. I finally began studying it in earnest in the fall of 2017, after finishing my doctoral dissertation.
The tidyverse((Tidyverse. Accessed February 21, 2021. https://www.tidyverse.org/)), which was born in 2016, gradually gained popularity, and the "space book"((Yuya Matsumura, Hiroaki Yutani, Yasunori Kinosada, Kazuhiro Maeda. R yūza no tame no RStudio [jissen] nyūmon — tidyverse ni yoru modan na bunseki furō no sekai —. Gijutsu-Hyohron; 2018. https://www.amazon.co.jp/dp/4774198536)) published in 2018 completely changed my image of R. Having continued to hone my skills since then, I find it deeply moving to finally be in a position to receive a complimentary copy of a book like this.
Overview
This book, "Dēta bunseki no tame no dēta kashika nyūmon," is the Japanese translation of "Data Visualization: A practical introduction"((Data Visualization. Accessed February 21, 2021. https://socviz.co/)). The original English version is available online, so if you want to check the content first, you might want to refer to that.
This book provides students and researchers a hands-on introduction to the principles and practice of data visualization.
・Provides a hands-on introduction using R and ggplot2.
・Shows how the tidyverse makes working with R easier and more consistent.
・Includes a package containing datasets, code, and functions.
—Elizabeth Bruch, University of Michigan
The cover and layout of this translated edition are introduced on the publisher's official Twitter account.
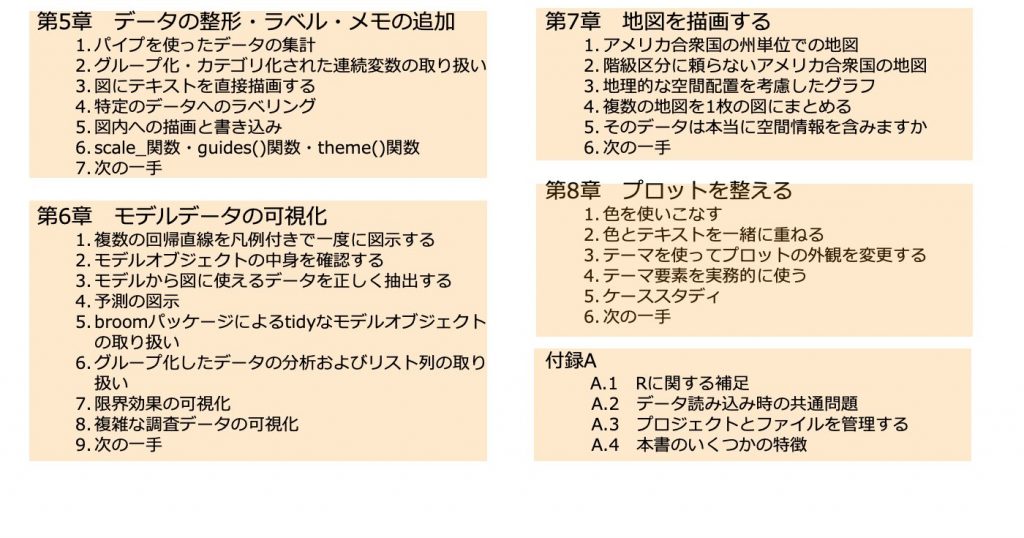
Table of contents and features
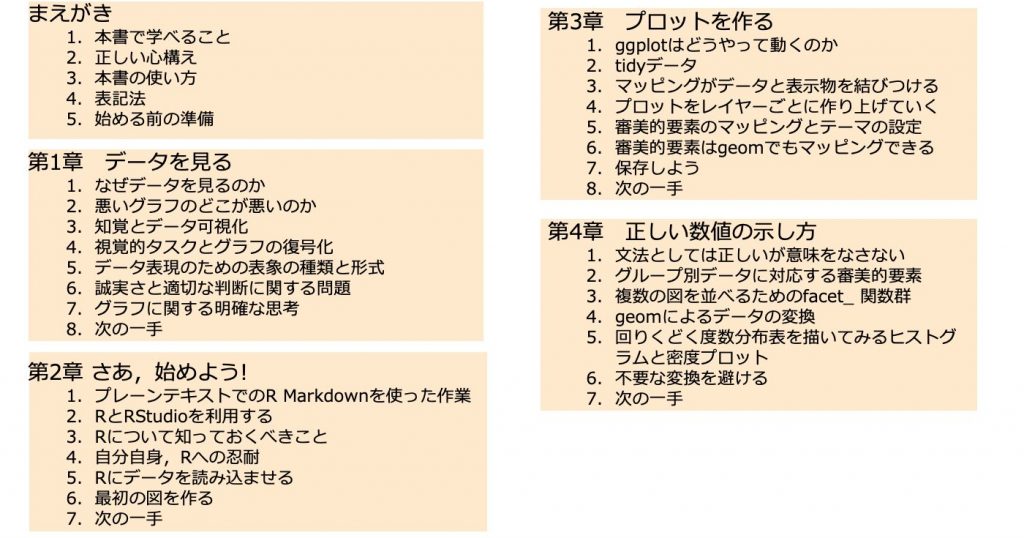
Chapter 1: Look at Data
Chapter 2: Get Started
Chapter 3: Make a Plot
Chapter 4: Show the Right Numbers
Chapter 5: Graph Tables, Add Labels, Make Notes
Chapter 6: Work with Models
Chapter 7: Draw Maps
Chapter 8: Refine Your Plots
Appendix A
The book opens with Chapter 1, "Look at Data," which begins with a section titled "Why Look at Data?" Lately, it has become increasingly easy to solve problems right away by Googling what we do not know. However, while the pages we find in search results describe the steps to take, they rarely explain the underlying way of thinking.
As many existing reviews((das_Kino. [Book Review] Dēta bunseki no tame no dēta kashika nyūmon. nora_goes_far. Published 1611638505. Accessed February 21, 2021. https://das-kino.hatenablog.com/entry/2021/01/26/142145))((Book Review "Dēta bunseki no tame no dēta kashika nyūmon"|Maxwell|note. note. Accessed February 21, 2021. https://note.com/maxwell/n/nab38d2b5648c))((ill-identified. [Book Review] "Dēta bunseki no tame no dēta kashika nyūmon" and the Recent State of R Graphics Packages. ill-identified diary. Published 1612359634. Accessed February 21, 2021. https://ill-identified.hatenablog.com/entry/2021/02/03/224034))((Recommended Even for Non-Data Analysts: "Dēta bunseki no tame no dēta kashika nyūmon"|hanaori|note. note. Accessed February 21, 2021. https://note.com/hanaori/n/ne3ef7b898a62)) have pointed out, a defining feature of this book is that it covers not only the How-To, but also the Mindset (Why) of visualization. I believe this is where its greatest value lies.
For example, at the risk of bringing up something very basic, when using ggplot2, you first create the base object like this:
p <- ggplot(mtcars, aes(x = as.factor(gear))) +
  geom_bar()
pCode language: HTML, XML (xml)
and plot it once, and then:
p2 <- p + coord_flip()
p2

p3 <- p2 + theme_bw()
p3
The book recommends this step-by-step method of saving and checking objects, while also explaining *why* you should do it this way. While this method itself is described in many other articles outside this book, I think few explain the reasons and thinking behind it.
I myself often focus solely on creating the target plot, stringing together ggplot2 syntax all at once and plotting only the final product. However, I must keep in mind that doing so skips the thought process gained from adding elements little by little while staying conscious of the structure and grammar, which may reduce opportunities to cultivate a deeper mindset toward visualization.
On visualizing geospatial data
As someone who works with geospatial data, I also learned a great deal from the book's perspective on what to keep in mind when visualizing it.
Next steps
The book introduces two paths forward. One is to continue practicing coding; the other is to look at graphs made by other people and apply what you have learned in this book to pay attention not only to the structure of the figure, but also to the structures implicitly contained within it.
For the first path, the book recommends two follow-up textbooks: "R for Data Science" (Japanese edition: "R de Hajimeru Data Science")((Wickham H, Grolemund G, Ohashi Shinya. R for Data Science. O'Reilly Japan; 2017. https://www.amazon.co.jp/dp/487311814X)), which explains the tidyverse in greater detail, and "R Programming for Data Science"((1. R Programming for Data Science. Accessed February 21, 2021. https://bookdown.org/rdpeng/rprogdatascience/)). I own most of the O'Reilly Japan books, including "R for Data Science." Their thickness can be intimidating at first, but the content is very readable and easy to understand, so I recommend them.
To help you study graphs made by others, the book introduces "The R Graph Gallery"((Holtz Y. The R Graph Gallery – Help and inspiration for R charts. The R Graph Gallery. Accessed February 21, 2021. https://r-graph-gallery.com/)), which collects various types of charts created with ggplot and other R tools, and "Policy Viz"((Learn Data Visualization & Better Presentation | Policy Viz. PolicyViz. Accessed February 21, 2021. https://policyviz.com/)), which covers a wide range of topics in data visualization.
If you want to study geospatial data in greater depth, I think you will need additional resources. The sf package((yutannihilation. It seems the world is moving toward the sf package when doing GIS in R. Technically, technophobic. Published 1483706013. Accessed February 21, 2021. https://notchained.hatenablog.com/entry/2017/01/06/213333)), which has grown popular recently, still seems to receive little coverage in books (please let me know if you have any recommendations). For geospatial data, I found "An Introduction to R for Spatial Analysis and Mapping" (Japanese edition: "R ni Yoru Chiri Kukan Data Kaiseki Nyumon")((Brunsdon C, Comber L. An Introduction to R for Spatial Analysis and Mapping. Kyoritsu Shuppan; 2018. https://www.amazon.co.jp/dp/4320124391)) helpful. However, this book was also written before sf came out, so topics related to sf appear only in the appendix. When I asked @yutannihilation((Hiroaki Yutani (@yutannihilation) / Twitter. Twitter. Accessed February 21, 2021. https://twitter.com/yutannihilation)), one of the translators of the book under review, in a certain community((Welcome to r-wakalang. Qiita. Accessed February 21, 2021. https://qiita.com/uri/items/5583e91bb5301ed5a4ba)), he recommended Geocomputation with R((Muenchow RL Jakub Nowosad, Jannes. Geocomputation with R. Accessed February 21, 2021. https://geocompr.robinlovelace.net/)) (in English) and Visualization and Analysis of Geospatial Data Using R((Basics of Geospatial Data | Visualization and Analysis of Geospatial Data Using R. Accessed February 21, 2021. https://tsukubar.github.io/r-spatial-guide/introduction.html)) (in Japanese).
An errata list is also updated regularly on the support page.
Conclusion
When you are looking at data, visualizing it clearly and appropriately cannot be achieved through methods and techniques alone. Whether you are practicing coding or learning by studying graphs made by others, you need a way of thinking about visualization. I believe the approach taught in this book will serve as a visualization mindset and a foundation for lifelong learning.